

Cards and the showcase
Every card type, what it needs, and how to try them with made-up readings.
Layout editor
Arrange cards, build several dashboards, and choose what opens on computers and phones.
Device controls
Change inverter and battery settings safely from the Controls page.
The layout editor's library has every card, grouped the same way as on this page. Cards that draw energy flows, charts, tables, costs or savings work from your metric roles, so it's worth setting those up first.
Try them in the showcase
The showcase, at /showcase, shows every card filled with made-up readings from an imaginary home that
change every few seconds. It's the easiest way to see what each card can do: play with its options
(size, titles, time periods, styles) as much as you like. Nothing on that page touches your data or
your devices. You'll need to be signed in to open it.
Energy flow
| Card | What it shows |
|---|---|
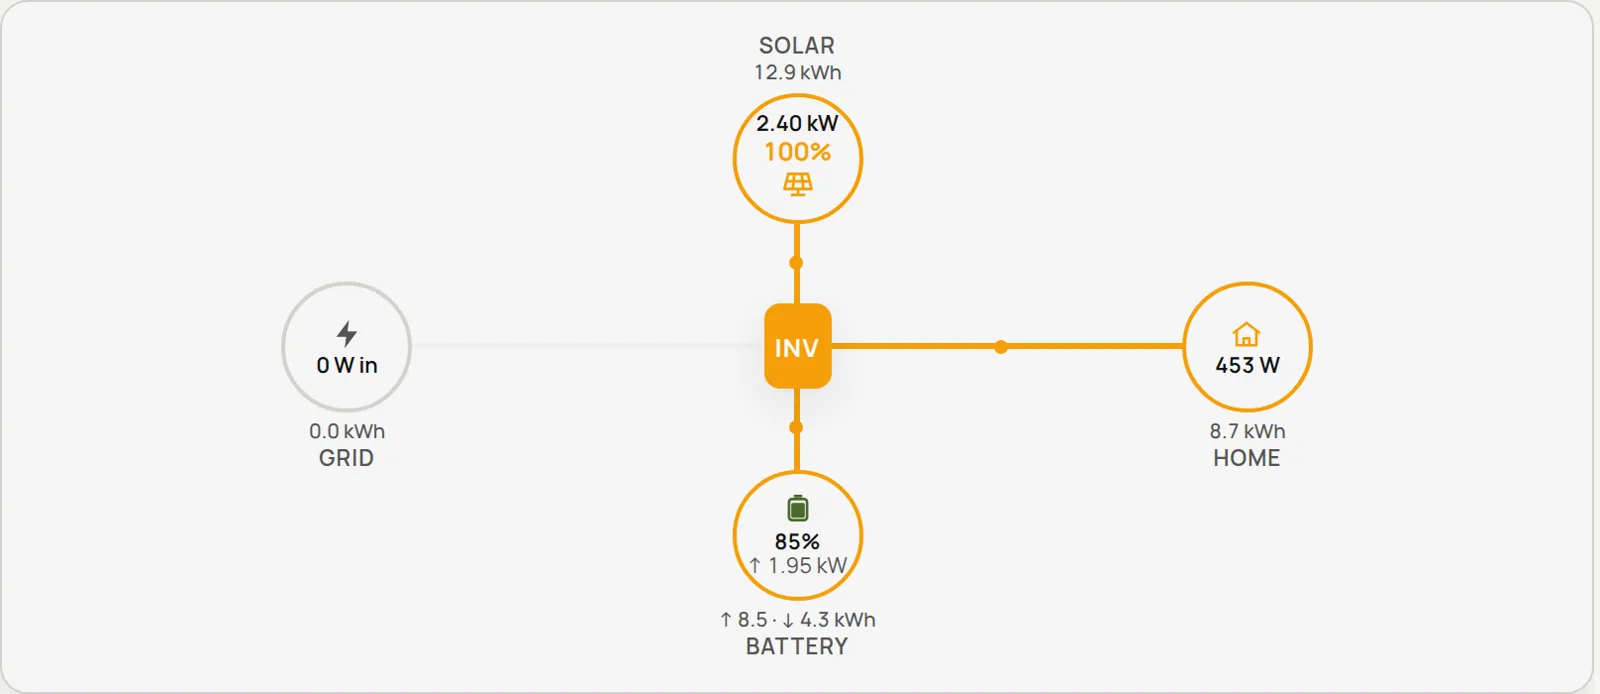
| System topology | An animated flow between solar, battery, grid and home |
| System overview | Grid, battery, solar and home tiles with 24-hour sparklines, arranged around the inverter |
| Flow card | Power flow, with an optional solar gauge |
| Flow square | A square flow layout with a picture of your inverter |
| Flow square, alternate | The same square layout without the inverter picture |
These use the power roles, or the metrics you pick on the card.
Values
| Card | What it shows |
|---|---|
| Metric cards | A row of big single values |
| Metric trend | A live value, with an optional history or forecast graph |
| Dual metric | Two live values side by side |
| Multi-value list | Rows of labels, values and units |
| Text metric | One metric's current value as text |
| Grid status | Whether the grid is on or off, the hours, a 24-hour timeline, and optionally costs and hours per day |
| Day totals | Today's energy to and from the grid, consumption and solar, compared with the forecast |
| Savings | What you've saved today, this week, month, year and in total |
Grid status needs a grid status metric, and Savings needs the daily solar role plus your prices.
Gauges and bars
| Card | What it shows |
|---|---|
| Gauge | One value on a round dial |
| Configurable gauge | A dial you can configure fully, with coloured bands and history |
| Half gauge | One value on a semicircle |
| Half gauge, centre zero | Zero at the top, filling to the right, or to the left for negative values |
| Bar gauge | Horizontal bars for several metrics |
| Bar gauge, segmented | LED-style segmented bars for several metrics |
| History bars | One metric's history as coloured vertical bars |
| Stacked history bars | Several metrics stacked up in each time slot |
| Threshold bar | One value against coloured bands |
These work with any metric.
Charts and tables
| Card | What it shows | Needs |
|---|---|---|
| Power chart | Solar, load, battery and grid power over the last 24 hours or 3 days, plus the generator whenever it ran | The power roles |
| Energy chart | Daily solar, grid and load energy as bars (the last 7 days by default) | The daily energy roles |
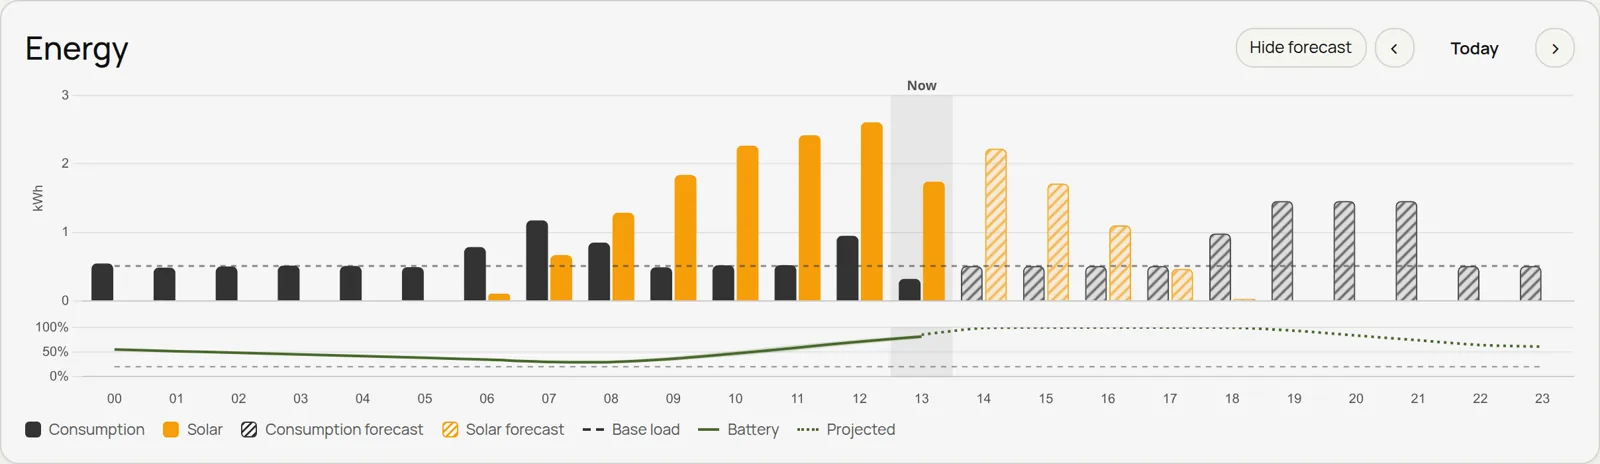
| Energy day | Hourly consumption, solar and generator with the forecast, and the battery's charge | The power roles |
| Energy flows | Where each hour's energy came from and where it went | The power roles |
| Costs and earnings | Hourly grid and generator costs, grid earnings and battery wear, with totals for the day | The power roles and your prices |
| Energy, tabbed | Energy day, flows, costs and day totals in one card | As above |
| Metric chart | Any metrics over time, with units and scale | Any metric |
| Daily table | Energy totals for each of the last 30 days | The daily energy roles |
| Monthly table | Energy totals for each of the last 12 months | The daily energy roles |
Forecast and weather
| Card | What it shows |
|---|---|
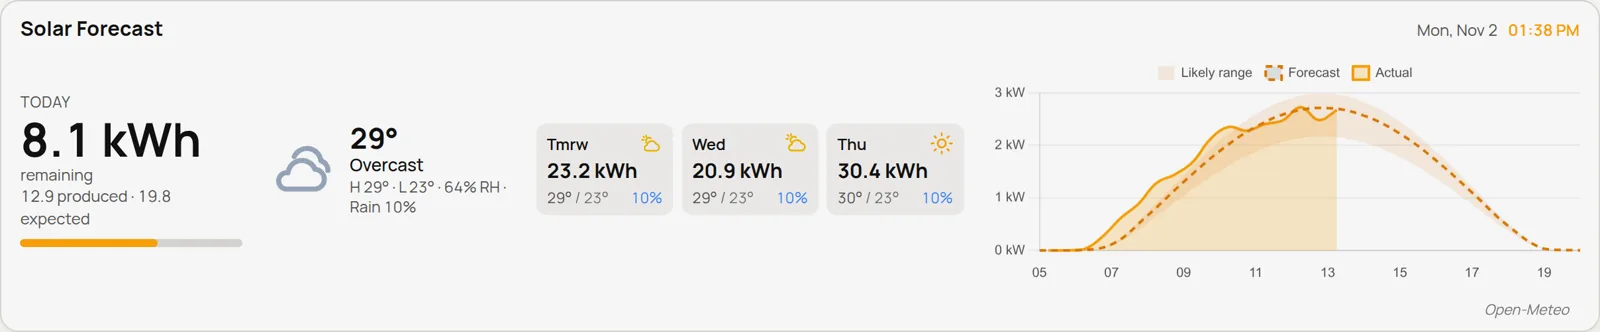
| Solar forecast | Today's production, the next few days, the weather and a chart |
| Solar forecast summary | Today and the next few days, without the chart |
| Solar forecast chart | Today's actual solar power against the forecast |
| PV today | A summary bar, a weather timeline and a chart |
| Weather | Current conditions, the forecast and any alerts |
These need Forecast and weather to be set up.
Controls
| Card | What it does |
|---|---|
| Toggle switch | Turns something on or off |
| Button | A big icon button: tap to toggle, turn on or off, or press |
| State select | Picks one of several states |
| Slider | Drag to set a number, such as a charge current or a level |
| Rotary knob | Turn a knob to set a number |
Control cards only work on the Controls page; if you put one on a dashboard, it shows a link to that page instead. See Device controls.
Text and embeds
| Card | What it shows |
|---|---|
| Text | A note or heading you write yourself |
| Embed | Another web page, shown inside the card |
Last updated on